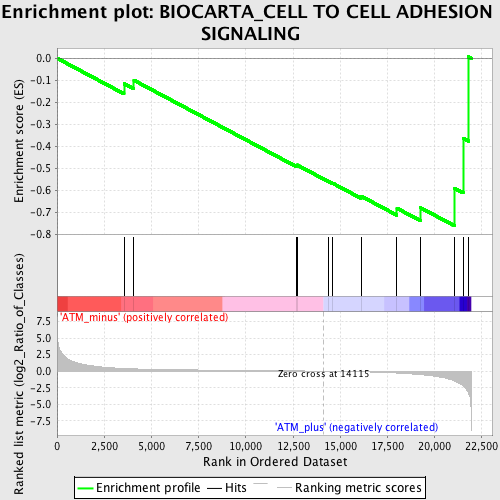
Profile of the Running ES Score & Positions of GeneSet Members on the Rank Ordered List
| Dataset | Set_01_ATM_minus_versus_ATM_plus.phenotype_ATM_minus_versus_ATM_plus.cls #ATM_minus_versus_ATM_plus.phenotype_ATM_minus_versus_ATM_plus.cls #ATM_minus_versus_ATM_plus_repos |
| Phenotype | phenotype_ATM_minus_versus_ATM_plus.cls#ATM_minus_versus_ATM_plus_repos |
| Upregulated in class | ATM_plus |
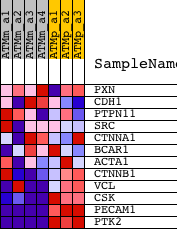
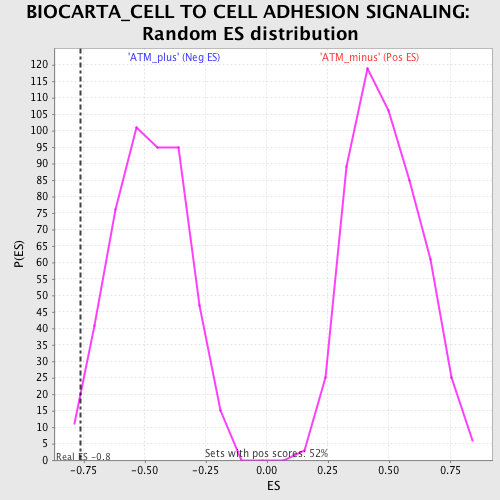
| GeneSet | BIOCARTA_CELL TO CELL ADHESION SIGNALING |
| Enrichment Score (ES) | -0.76185966 |
| Normalized Enrichment Score (NES) | -1.5857854 |
| Nominal p-value | 0.01871102 |
| FDR q-value | 0.28300062 |
| FWER p-Value | 0.997 |
| PROBE | DESCRIPTION (from dataset) | GENE SYMBOL | GENE_TITLE | RANK IN GENE LIST | RANK METRIC SCORE | RUNNING ES | CORE ENRICHMENT | |
|---|---|---|---|---|---|---|---|---|
| 1 | PXN | 1424027_at 1426085_a_at 1456135_s_at | 3543 | 0.405 | -0.1156 | No | ||
| 2 | CDH1 | 1443509_at 1448261_at | 4070 | 0.347 | -0.1001 | No | ||
| 3 | PTPN11 | 1421196_at 1427699_a_at 1451225_at | 12683 | 0.041 | -0.4882 | No | ||
| 4 | SRC | 1423240_at 1450918_s_at | 12710 | 0.041 | -0.4848 | No | ||
| 5 | CTNNA1 | 1437275_at 1437807_x_at 1443662_at 1448149_at | 14357 | -0.009 | -0.5589 | No | ||
| 6 | BCAR1 | 1439388_s_at 1450622_at | 14577 | -0.017 | -0.5669 | No | ||
| 7 | ACTA1 | 1427735_a_at | 16097 | -0.087 | -0.6263 | No | ||
| 8 | CTNNB1 | 1420811_a_at 1430533_a_at 1450008_a_at | 18001 | -0.278 | -0.6815 | Yes | ||
| 9 | VCL | 1416156_at 1416157_at 1445256_at | 19248 | -0.521 | -0.6791 | Yes | ||
| 10 | CSK | 1423518_at 1439744_at | 21063 | -1.495 | -0.5919 | Yes | ||
| 11 | PECAM1 | 1421287_a_at 1447092_at | 21505 | -2.184 | -0.3638 | Yes | ||
| 12 | PTK2 | 1423059_at 1430827_a_at 1439198_at 1440082_at 1441475_at 1443384_at 1445137_at | 21796 | -3.373 | 0.0064 | Yes |